

Announcement
TradingView is the world's leading charting platform, trusted by millions of traders and investors. By integrating their Advanced Charts library, we bring that same reliability and feature set directly into Bitculator - no separate account or tab required. Track Bitcoin price, Ethereum and other criptocurrencies directly on Bitcalculator.
Whether you're tracking Bitcoin's price action, analyzing altcoin trends, or studying market patterns, TradingView's charting technology provides the depth and precision needed for informed decision-making.
What's New
Every asset page on Bitculator now features a toggle between two chart views:
Line Chart — Our existing clean, fast-loading line chart that gives you a quick overview of price movements across multiple timeframes. Perfect for at-a-glance analysis.
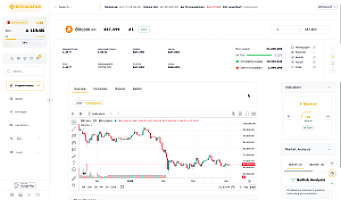
TradingView Chart - A full-featured interactive chart powered by TradingView's Advanced Charts (https://www.tradingview.com/advanced-charts/) library. This view includes:
Candlestick and OHLC charts - See open, high, low, and close prices for every time period, essential for technical analysis.
100+ technical indicators - From RSI and MACD to Bollinger Bands, Ichimoku Cloud, and many more. Apply multiple indicators simultaneously to build your analysis.
Drawing tools - Trendlines, Fibonacci retracements, channels, and other drawing tools to annotate charts and identify patterns.
Multiple timeframes - Switch between 15-minute, 1-hour, 4-hour, daily, weekly, and monthly views with full historical data.
Dark and light themes - The chart automatically matches your Bitculator theme preference.
How to Use It
Using the new TradingView charts is simple:
1. Navigate to any cryptocurrency page on Bitculator.
2. Look for the Line / TradingView toggle in the chart toolbar.
3. Click TradingView to switch to the advanced chart view.
4. Use the resolution buttons at the bottom of the chart (15m, 1H, 4H, 1D, 1W, 1M) to adjust the candle timeframe.
5. Right-click the chart or use the toolbar to add indicators and drawing tools.
The line chart remains the default view for quick, lightweight price checks. Switch to TradingView whenever you need deeper technical analysis.
Why TradingView
TradingView (https://www.tradingview.com/) is the world's leading charting platform, trusted by millions of traders and investors. By integrating their Advanced Charts library, we bring that same reliability and feature set directly into Bitculator - no separate account or tab required.
All chart data is served from Bitculator's own infrastructure using our existing real-time data feeds, ensuring fast load times and consistent data across both chart views.
Available Now
The TradingView Advanced Charts integration is live on all cryptocurrency asset pages. Simply visit any asset page and try it out - no login required.
We're committed to continuously improving the tools available on Bitculator. This integration is a significant step toward providing our users with everything they need for cryptocurrency research and analysis in one place.