

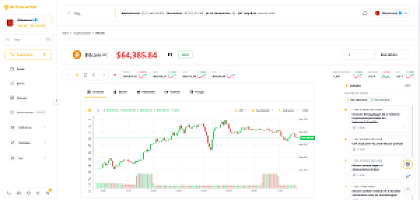
A crypto analytics platform lives and dies by its charts. So we built our own. BitChart is Bitculator's in-house charting engine - written from a blank file, in-house, top to bottom - and it now renders every single chart on https://bitculator.com: from the big price chart on an asset page down to the smallest sparkline.
Open the Bitcoin chart and you're looking at it.
Why write a chart engine ourselves?
Because owning the chart means owning the experience:
- One engine, one look. The platform's clean area chart and the full candlestick pro mode are two skins of the same engine - switch with one click, and your drawings and settings survive.
- Our roadmap, at full speed. When users ask for an indicator or a drawing tool, we build it and ship it. Nothing stands between a feature request and the chart.
- Performance we control. BitChart is framework-free TypeScript rendering straight to canvas, with zero runtime dependencies. Data is decimated and paths are cached, so a year of minutely candles pans and zooms without stutter - and the page stays light, because a hand-built engine carries no dead weight.
Pro mode: a full trading terminal in the page
Flip the chart to candles and BitChart becomes a serious workspace:
- Nearly 100 built-in indicators - from the staples (RSI, MACD, Bollinger Bands, moving averages of every flavor) through Ichimoku Cloud, SuperTrend, Parabolic SAR, ADX, volume studies, volatility estimators, and cross-asset studies like rolling correlation against a compared coin. Oscillators open in their own stacked sub-panes, overlays draw on price.
- A complete drawing suite - 80+ tools - trendlines and channels, Fibonacci retracements, extensions, fans and circles, pitchforks, Gann tools, Elliott waves, harmonic patterns, long/short position tools with risk/reward, anchored VWAP, regression trends and volume profiles. With magnet snap to OHLC, undo/redo, and drawings anchored in data coordinates so they stay put through every zoom, pan and timeframe change.
- Live by default. Prices on Bitculator refresh roughly every minute, while live socket updates keep the chart moving continuously. The latest candle updates in place and seamlessly rolls over into a new one - without ever resetting your view.
- Compare any two assets on dual axes - each asset keeps its real price scale, left and right, with per-series hover readouts. Or press LOG and read decades of Bitcoin history the way it's meant to be read.
Not just the price chart
BitChart runs the whole platform: exchange volume charts, the comparison tool, portfolio value tracking, RSI panes, allocation donuts, and the charts inside our DCA, staking, interest and profit calculators all draw with the same engine. Same crispness everywhere - including the versions you can embed on your own site.
And the data feeding those charts? It's the same data you can pull yourself through the Bitculator Data API.
Try it
Open any asset - say Bitcoin or Ethereum - flip to candles, drop a Fibonacci on the last swing, add an RSI, and compare it against another coin. No plugin, no account required. Just our chart, doing what we built it to do.
This is one of those projects that's never really finished - new indicators, tools and refinements ship continuously. If there's a study or drawing tool you're missing, tell us. It's our engine; we can build it.